

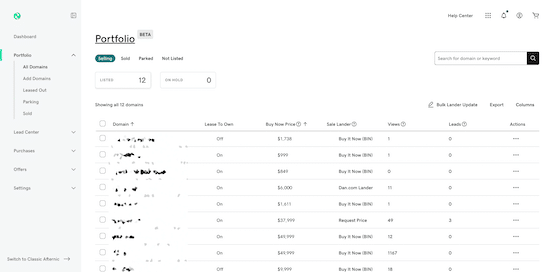
Afternic has added two columns to its dashboard that will be of interest to domain investors who use the platform to sell domain names. Users can now see the number of visits to the domain name in the trailing 30 days and the number of leads the domain name generated in that time period.
To access (or remove) this new data provided by Afternic, users can select and add columns for Views and Leads on their dashboard. A generic screenshot of this shared by GoDaddy is posted above.
Domain names must be parked on any of Afternic’s nameservers to have access to traffic stats. Domain names listed for sale on Afternic but via Dan.com will not show stats on the Afternic dashboard. Instead, users can visit their Dan.com dashboard to see those stats. Users who toggle between different Afternic-hosted landing pages will have a full view of their monthly stats, so landing page design changes don’t matter for this.
Users who want more data can click the link to their domain name on the dashboard to have access to these data points for the past 12 weeks. This data can be exported via CSV for those customers who wish to track their data off-site.
At the time of this change, the traffic and lead columns are static. Users are unable to sort domain names by the amount of traffic or leads in this first iteration of traffic stats. Hopefully that is coming. In addition, I hope Afternic enables users to sort by lead recency as well, like we can do at Dan.com.